I use Google Meet every day for (potentially hours of) online meetings at work, so it’s very easy to notice when things change and for example new features are available. Recently I’ve found a new “Call Control” section in the settings that promised a lot of fun, connecting USB devices to control my calls.
Google Meet Settings menu during a call, witht the Call control section
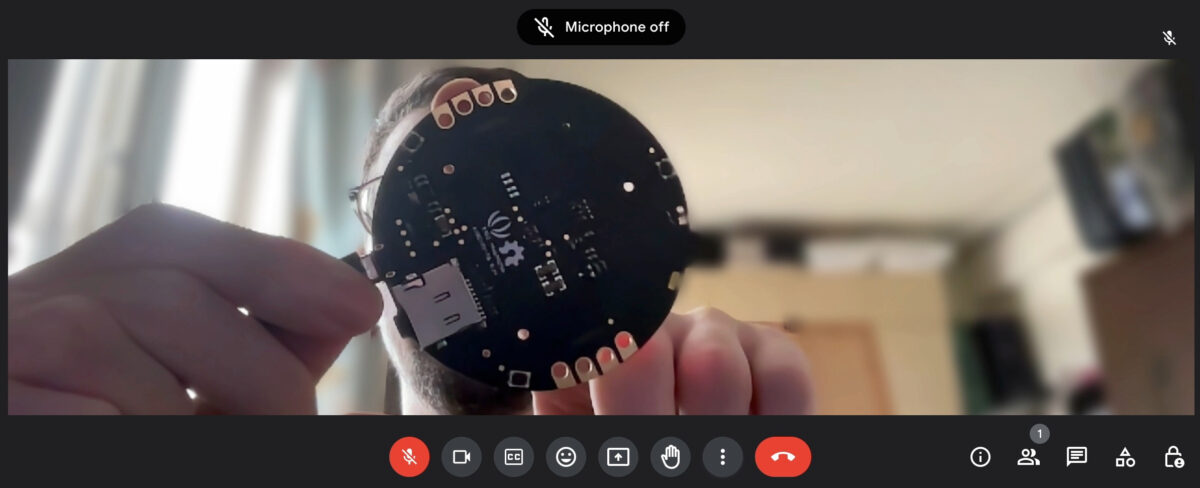
As someone who enjoys (or drawn to, or sort-of obscessed with) hacking on hardware, this was a nice call of action: let’s cobble together a custom USB button that can do some kind of call control1: say muting myself in the call, showing mute status, hanging up, etc.
This kicked off such a deep rabbit hole that I barely made it back up to the top, but one that seeded a crazy amount of future opportunities.
Just a bit more than a year ago I’ve started to work on a hardware idea as a challenge – a mini-PCIe form factor Arduino clone, the PCIeDuino. The inspiration was working with a bunch of embedded boards, especially the VIA VAB-600 Springboard, that had a mini-PCIe connector, but not that many accessories that can go in there. (Disclaimer, I work at VIA at the moment, though this wasn’t a work project). I thought it would be cool to put an embedded-grade microcontroller on these boards, mostly to expand the I/O capabilities.
Idea
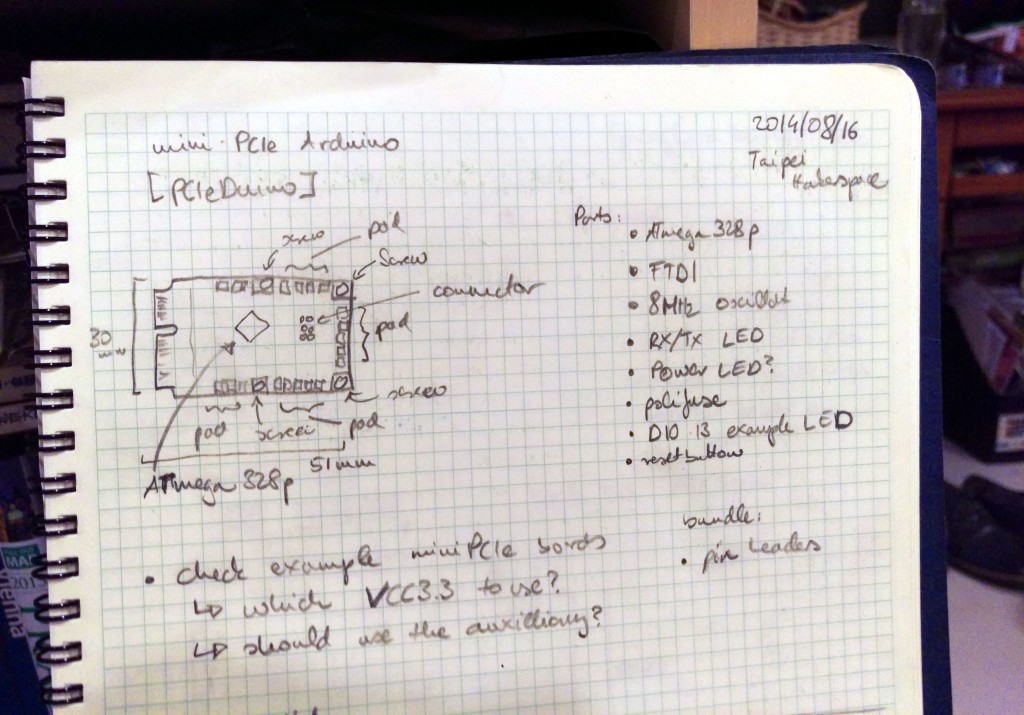
The original PCIeDuino sketch in my lab book
Looking at the mini-PCIe specs, the connector has mandatory USB 2.0 lines so communication was solved. The area available, roughly 5.1 x 3.0 cm, is not too bad -more than how big the Arduino Nano is in comparison. The biggest challenge probably was that there are only 3.3V power lines available, and most example designs use 5V power supply.
I have signed up to support it for two main reasons: it’s a Taiwanese project (Skytraq, the company behind Navspark is in in Hsinchu city in Taiwan), and I haven’t seen anything about Beidou before.
They barely made the campaign, but it’s not for the lack of quality. There were a lot of updates during and afterwards as well as the project was developing. Those were good behind the scenes information, got to see what parts of hardware development are more troublesome than others.
The Navspark board
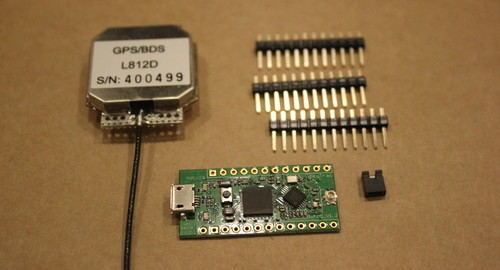
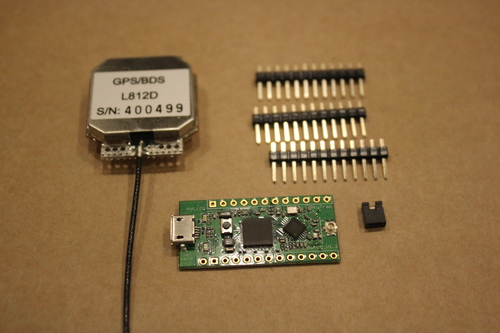
Navspark unboxing: board, antenna, pins
The rewards just shipped this week, and since for this campaign I’m a “local”, I got it pretty early. I got my Navspark GPS/Beidou (BD) version in a big envelope, together with an antenna, some pin and a jumper.
One issue we have frequently at the Taipei Hackerspace is that people don’t know when we are open. Our basic rule is simple: whenever a keyholder member is in the Hackerspace, anyone/everyone can come. In practice people never really know if anyone’s there.
They could give a call to the space, or even send an email to the mailing list, while the people I know usually end up asking me directly – hey, anyone’s at the space at the moment? Since I don’t always know the answer, the search was on for a better – maybe more technological or hackish solution: let’s build an electronic check-in/out system that will show the current status on out website, so people can check right there.
I had the following idea in the back of my mind for a few weeks and even got the hardware acquired, but one of our co-founder had to call me out by name on the mailing list, a few days ago to swing into action. So now here it is, kinda working, ready for real usage.
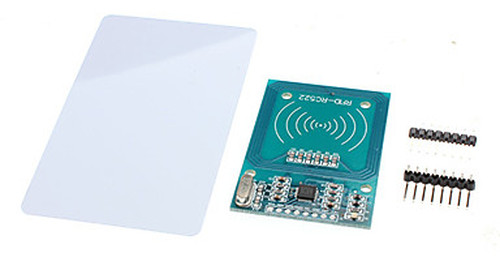
The main idea is that in Taipei pretty much everyone has an EasyCard, an 13.56MHz RFID card that is used for all public transport in the city and a lot more. The RC522 card-antenna module seems to be able to read the card pretty well, and all I need to get off it is the the ID number which is pretty straightforward (after digging the Arduino forums for source code).
The project in a nutshell is:
Use Arduino Mega with an RC522 board to get the ID number of a given EasyCard
Use witches to get whether the person is checking in or out
Use LEDs to provide some feedback and basic user interface for the hardware
Node.js server to communicate with the Arduino, interface the check-in/out database, and provide API and realtime access to the data
Create a bit of interface on the website to display the check-in status
Now let me dig into the different parts in detail.
RFID
The RC522 module has 8 pins, and Arduino can use the SPI library to communicate with it. I used Arduino Mega ADK, because the SPI pins are conveniently accessible, unlike e.g. the Leonardo, for which I would have had to make some new cables or headers. The RC522(pin number)->Mega(pin number) connections are done such that:
SA(1) -> SS(53)
SCK(2) -> SCK(52)
MOSI(3) -> MOSI(51)
MISO(4) -> MISO(50)
(5) not connected
GND(6) -> GND
RST(8) -> (any digital pin)
+3.3V(8) -> +3.3V
RFID-RC522, with blank card and pins
The source code to talk to the card is from a blog, and originally from a tech shop in China, I guess (based on the big bunch of Simplified Chinese comments).
Switches and Visual Feedback
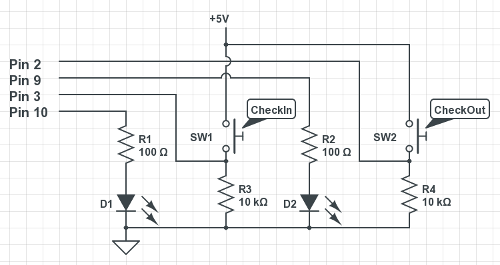
I wanted to make as simple interface for the card reader as possible. Added this pair of switches and LEDs (the D1 being green, and D2 being red). After the Arduino received a card ID from the reader, the LEDs are blinked to prompt people to press either the Check In or Check Out buttons. If they press either of them, the corresponding LED is blinked very brightly for a bit, and the card ID and check-in/out event is sent to the connected computer via serial connection
The (very basic) circuit for the check-in/out buttons and visual feedback LEDs. “Pins” refer to the Arduino pins used in the current version
If no button press occurs within 10 seconds or so, the reading is discarded and the card reader goes back to listening mode.
Webserver
Node.js is very useful to make quick web services, and its library support is not too bad at all, although it’s not all smooth sailing: their documentation is often scarce at best. Nevertheless it was the fastest one to get things up and running, since I have used before almost all required components.
The server communicates with Arduino via the serialport library. I’m more used to Python’s pyserial, though in this case it was very handy that serialport can emit read events, thus the server can just wait until there’s something to read and run some functions on the incoming data. In my experience, serialport wouldn’t be good for every cornercase I came across in serial-land, but in this setup works beautifully.
I chose SQLite3 to store the data, using the sqlite3 library. There are a bunch of others, had to look around which one is still being developed. This particular library is not too bad, though I found myself fighting the lack of documentation and asynchronicity quite a bit. The resulting code is pretty ugly I’m sure, in some places inefficient because I didn’t know how to get to the result I wanted in a less roundabout way, still it seems to work and that is what matters for a prototype.
First I made a simple REST API to query the currently checked-in people, and later added (real-time) push updates via socket.io, to make it nicer. It’s brilliant that without any polling, all clients can be updated once someone signs in or out.
Since this code is running on a different computer than our main web server, had to play around with the Access-Control-Allow-Origin header, and adjusting the settings of our router to make it accessible for the web correctly.
Tried to add a pretty-much self-contained script that the front-end can load, and it handles everything, just need an appropriate HTML span or div element to display the information.
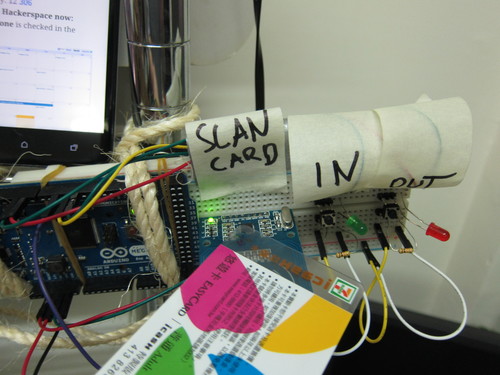
Hardware setup for checking in/out: Arduino Mega, RFID-RC522 circuit, and some switches and LEDs.
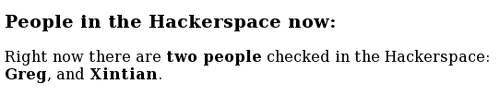
The result is pretty good, as long as the card-reader does not crash. Originally the results were displayed in a table, but wanted to make it more human, so here’s the format I ended up with:
Screenshot of the homepage with one particular check-in situation.
There can also be people with no name, they just show up something like “Right now there are three people checked in the Hackerspace: Greg, and two other people.”
It lives!
Here’s a quick demonstration video of how does it work:
So you can check out our website at http://tpehack.no-ip.biz/ for the live results, and drop in if you are in the neighbourhood if there’s anyone in the ‘space.
The whole source code is shared in a Github repository: the Arduino sketch, the server script, and any additional files. I’m sure there are a lot of things that could be improved about it.
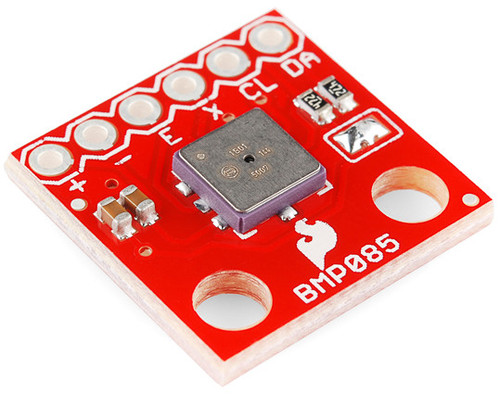
It all started a few weeks ago with Sparkfun having “20%-off” day, when I got myself (among other things) a BMP085 barometric pressure sensor. When it arrived, I have soldered some pins on it, and set it up with an Arduino Nano, to have the readings off it easily.
BMP085 barometric pressure sensor breakout board from Sparkfun
Originally all I wanted is just some laid back pressure recording, so maybe I can use that to predict the weather a bit. “Pressure falls: bad weather comes, pressure rises: things will clear up”. I was recording for about a week, and nothing really noteworthy came out of that.
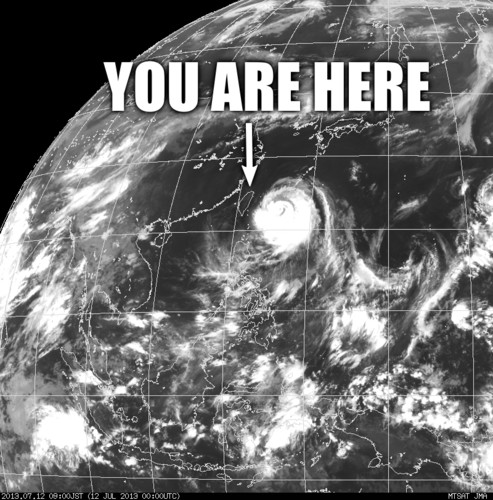
Then it was the news, that the year’s first typhoon is on the way to Taiwan, and it was supposed to be a big one. Obvious that I will try to record the barometric pressure pattern of its passing, but wanted to make it more interesting and informative. More visual than just the timeseries plot of pressures.
The Japanese Meteorological Agency (JMA) is a good place to watch for information about typhoons. They list path prediction, typhoon properties like strength, wind speeds, and central pressure, have satellite imagery. Putting these together, two days before the typhoon arrived, I set up a script to download the satellite imagery as it became available.
The morning before the typhoon arrived
The JMA publishes usually 2 satellite images in an hour for our North Western Quadrant (at :00 and :30), one of them covers the whole area, the other covers just the top 80% or so, leaving a dark band on the bottom. Nevertheless, matching up the pressure reading with the satellite pictures would be a good little project for this time.
Friday came, the government gave the afternoon off, though it turned out no landfall happened till everyone supposed to be off anyways, just a bit of on-and-off rain. People stocked up on convenience store food (I now have a good supply of instant noodles:) and water, taped over their glass windows, take in their plants and BBQ equipment from outside – well, those who have planned.
Around 10pm the big rain has arrived, here’s a video of how it looked from my window. Went to sleep later, and got woken up around 3:30am by the rain having changed into pretty darn big wind. Here’s another video of the violent part of the typhoon that time in the morning, that doesn’t even really do it justice. The houses around here are pretty tall, and I wonder if they have protected from the wind, or been artificial canyons channeling it. Some things got broken, though not as much as I expected – which is a very good thing.
In the meantime by the power of the Internet I have checked out the pressure reading, how is it going a few miles away in the Taipei Hackerspace, where I have left the barometric pressure sensor (the geolocation is 25.052993,121.516981)
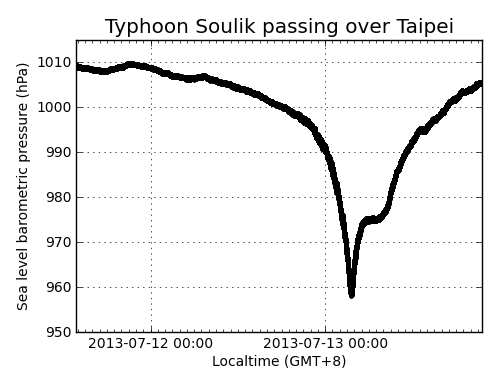
Here’s the entire recording of the approximately 2 days of typhoon. It was pretty okay weather in the start and end of the plot.
Pressure reading during the passing of Typhoon Soulik, recorded at the Taipei Hackerspace
The readings have been corrected to sea level (from about 20m height, where the Taipei Hackerspace is), should be good within 1hPa or less.
The the pressure was indeed dropping like a rock, and the dip on the graph coincided with the most violent wind that woke me up. According the JMA, the central area of the typhoon had pressures down to 950hPa, which means that core must have passed pretty close to here, having readings below 958hPa, though probably not directly, as it didn’t stay down there for long.
I made a video syncing up the pressure reading and the satellite picture. The red dot on the video marks the recording location. (Watching it in full screen and HD makes it clearer.)
I would wonder what was the flat part in the readings while the typhoon was leaving. Maybe sign of changing direction, by the look of it.
Either way, this was fun to do, and I am glad that only a few people got hurt here, much fewer then even during the less powerful typhoons. Maybe getting people scared a little (like with this “super typhoon” stuff that went on) helps them keep safe? Just don’t use it too often.
Extra material
I put almost all material used here into a gist: the satellite imagery download script, the plotting, the movie frame generation, the movie generation script, and the complete barometric recording. Because this last part is pretty big (5Mb), Github truncated the rest of the scripts. I guess it’s okay to check check it out. Will add the Arduino sketch to read the sensor and the logging script later.
The satellite imagery weighs about 60Mb, so don’t put it online, but if anyone wants them, let me know.