A friend from NIST recently told me about a Raspberry Pi Stratum-1 NTP server project, and that reminded me of the experiments I did with the Navspark dual GPS+Beidou receiver module. Navspark is a small, Arduino-compatible module that besides GPS can also receive data from China’s Beidou 北斗 satellite navigation system , that is currently being built. I thought it would be fun to build a Beidou-powered Stratum-1 NTP server to see how does it compare to GPS.
Hardware
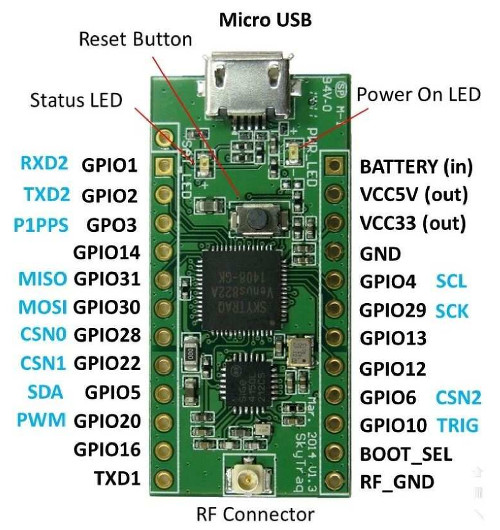
To have a really good really good, satellite-powered reference clock, I have to have access to a 1-pulse-per-second (1PPS) signal from the receiver. The pure USB-connected receivers don’t really seem to do that yet (looks like plenty of opportunities there!), instead I have to use separate hardware for it.
The Navspark module has a 1PPS pin (GPO3 below), and the only other pin I’ll really need is a serial pin to receive the NMEA stream of the satellite lock data (TXD1 below).
Experimental physicists have to be the jack-of-all-trades, even on a good day, but building a new laboratory, on a budget (for any definition of “budget”) and with a limited team, is an exercise that would test anyone.
For my field, atomic physics, one needs a lot of different expertise: vacuum systems, computers, electronics, machining, optics are among the ones first to my mind. Today I’m looking at one of the tools that we are using for the last topics: optics.
In some ways, optics is pretty straightforward (both geometrical and diffraction optics), many of the calculations one could write in Python/Numpy just as well, as any software can do it. They are just pretty tedious, and there are a lot of them, optics is not a new profession. Some optics design software is very useful then, and there are not that many of them, lots of work goes into the ones that exist, thus they can be extremely expensive. One of the industry standard seem to be Zemax, and many lens manufacturers provide the specs of their lenses in a Zemax format – though it is fortunately just a relatively simple text file. On the other hand, its cheapest edition is $2500, and goes up to $9500…
Another serious competitor is OSLO (Optics Software for Layout and Optimization) which is still very well known, and fortunately for us, has a dumbed down (limited number of surfaces, not all the functions available), EDU version, for free. It even runs on Linux with Wine.
I instinctively resist any software in science & research that is not free & open source, because I feel that it closes some people out, though had to use something, and in the meantime I have grown to OSLO quite a bit.
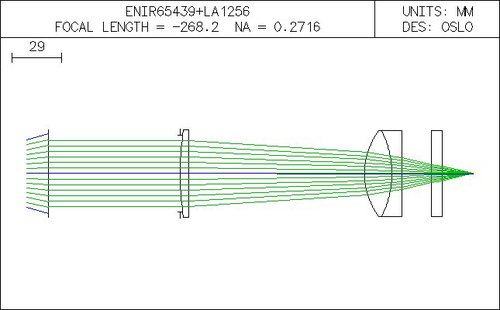
One of our imaging system design
Using OSLO, I have found that one big advantage of these software is their catalog: the glasses (oh-very-important for optics) and stock optics of different companies. This alone makes everything much easier.
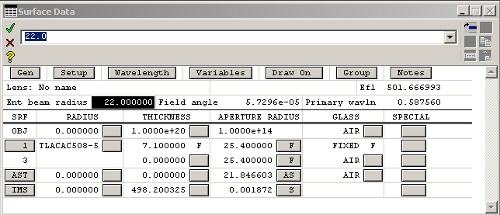
What does the lens designer software do? You enter the parameters of some lenses by defining different surfaces and materials & distances between those surfaces, give it some lightbeams, and see what comes out of it. Most of this happens in this window:
Lens spreadsheet
After these settings, one can run a number of different analytics code, checking the performance and behaviour of the system by calculating a bunch of physics parameters, or can modify the system to optimize that performance one way or another.
This is where the number 1 strangeness – and big bonus – comes in: OSLO can be scripted in a language called Compiled Command Language (CCL), which is a subset of C; and not just scripted, but the whole program is written on top of the CCL compiler (as I understand)! The result of this is that:
Your scripting can be just as powerful as the entire program, since both sides have the same functions accessible
There are a bunch of scripts included in the main version and even if CCL itself feels poorly documented, there are plenty of examples to learn from
Once your script is compiled for OSLO, it can be totally part of the system, your own menuitems, options, defaults, everything
Scripting is not just bolted on later, but the whole software feels like a result of “eating your own dogfood“, resulting in a much better experience.
Optics design is tedious, so once I figured out how to do the scripting, everything just become nicer. Haven’t had time to do a lot of things, but the script I have so far is open source, and hope to add other things later.
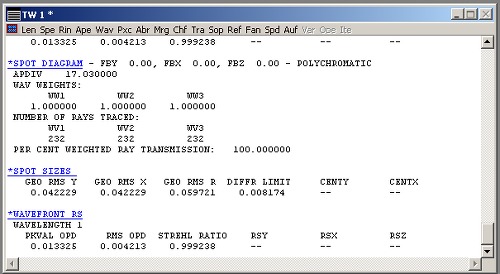
From the programming point of view, there’s one more strangeness. Starts with that the output of numerical calculations looks like this:
Looking at some numerical results
Those are all results from different functions, calculating spot sizes and wavefront distortions and what not, and those can be run from your own script – but the return variables are just printed. And they are a table. Those are table values that have to be accessed, so for example if I want to have the Strehl Ratio there, I would have to assign the value of something like “c1” to my internal variable – c for 3rd column, 1 for first row. Though to be this simple my code would have to clear the existing table before running the wavefront function correctly. This results in a lot of counting on the screen to see what row/column output of a function I want to actually use.
Internally, I think most of the calculations are following a finite number of rays. Finite but very high (~1000). The big problem, that could get the unsuspecting people (like I was), that what looks like a continuous calculation, is actually digital. For example if I set an aperture within the system that cuts into the incoming rays, and keep changing the aperture size (which is just a real number), the output results don’t really change unless I exclude or include some of the beams that OSLO is using for calculation – thus the result is changing in steps, and hard to trust. I guess there should be a setting somewhere to change the number of rays used, but still trying to find it.
It is one clever program though. The input and output parameters of a lightbeam are really connected by the system, since practically speaking, the optics are just transforming some parameters of the beam into other values, thus if I set the input parameters, the output is given. With OSLO they do this in a way, that the code just follows what parameters you have changed last time (input beam size? output image angles?…) and that will be a fixed variable, while everything else is adjusted. Some parameters disappear when others take certain values (set your object very far away? then we don’t have to let you set your object size, since it’s not important, instead give you a viewfield angle). It’s funky when I figured it out, but took a while…
I don’t know how much longer I’ll have to use it at work, but this looks something that really tickled my interest learning optical design much more, and once I have the hang of the quirks, it’s pretty neat. If anyone’s interested, there’s a pretty useful mailing list.
Now if only there was an open source solution… : ) (please drop me a line if there’s a good one)
Looks like that one of my specialty as a physicist, and contribution to the labs where I have worked so far, is bringing different kinds of programming techniques, and technologies to the table. I’m not saying I’m any better than many of the professors, post-docs, and students I’ve met so far (there are plenty of ingenious ones), it’s more like I experiment with different tools, have tried more of the cutting edge or recent technologies, did some web programming and could whip up something quick – that might not work very well at first, but does broaden the horizon for the rest of the people.
Also, I’m a lazy person, so want to automate as much as possible. That was on my mind recently when we have been preparing to do a vacuum-system bake-out. It’s essentially a procedure to have a delicate experimental system, mostly made up of steel, glass, and stuff like that, closed up from the atmosphere, all the air pumped out, then heated up to high temperature (~150-300°C). One has to be careful, because things can break, there are temperature limitations for some materials, also on how quickly that temperature can change, requiring careful monitoring of the status of the system. And the whole thing takes something like two weeks or more. Perfect setting for automation.
Set up the electronics
The pressure measurements are done by some expensive other equipment so didn’t have to bother with that one yet, so set to work first on the temperature monitoring. Before it was a bunch of thermocouples and multimeters, requiring manual intervention and lots of labour. Instead, got some inspiration from Adafruit’s Thermocouple Breakout Board, using the MAX31855 chip, and also from the Thermocouple Multiplexer Shield. It can handle only one channel, but can use some other chip together with it to switch between the different thermocouples, and so we can read it out one-by-one. The Adafruit board could only handle 1 channel, and the multiplexer shield was using an older chip for the measurement that I could not buy anymore. In the end, found a good analog multiplexer that one that is sold in the computer market here in Taipei, the CD4067B, and it works pretty well.
Breadboard setup for temperature monitoring with Arduino
Of course, setting it all up was quite a bit of fun times, as there were way too many gotchas along the way.
MAX31855 is a surface-mount component, and haven’t worked with it before. Not too bad, and can be much neater, just takes some plactice
MAX31855 is a 3.3V circuit, so the CMOS voltage levels used by my Arduino Mega ADK had to be level shifted
Unlike the older chip, MAX31855 really needs differential input, and it’s much more sensitive to the environment. This required different kind of analog multiplexer than that board had
The Arduino Mega is a new model for me, and had some strange behaviour in terms of the serial communication
Surprisingly there are not too many options for 3.3V voltage regulators over here, just the LM1117, which is different from what others are using elsewhere
Lots of noise and stability issues until figured out what should be how. For example under no circumstance should touch the thermocouple to conducting surfaces, and avoid ground loops
While MAX31855 says it’s “cold-point compensated”, meaning that it accounts for the chip-s local temperature when measuring the thermocouple, it doesn’t appear completely compensated, meaning that we can have unexpected measurement change because the chip is heating up for example by being in a closed box.
Figuring out the right amount of time to wait between switching channels (375ms seems to be good enough, 500ms is totally fine)
In the end, though, we did have a nice 16 channel thermocouple multiplexer, sending off the measurements onto an LCD screen and to the computer over an USB cable.
Temperature monitoring board in it’s lab setting with 16 thermocouple channels
This is then saved in a database, and can be accessed from elsewhere.
Visualize!
The thing that my co-workers were most amazed by wasn’t the electronics. Sure, they haven’t worked with Arduinos, but did do similar stuff. Instead they liked the monitoring interface much more, this is the one on the picture right here (can click to enlarge)
Bakeout Monitor interface (click image for full view)
It’s the schematic layout of our equipment, with the temperatures positioned where the actual sensors are. Also, the change of the measured values in time are also displayed with live scrolling.
I’m not saying it’s great. Thinking about it, the major insight that made it good for the rest of the people is that I realized how much more people understand visual data: the placement of the values to the corresponding locations on the schematics. That’s the only thing.
It was actually quite fun to write it all, and the gradual improvements, trying the new tech, trying not to lose to much data, amazed how well it works. Especially had a good time learning about the database, scaling, fault tolerance, performance…
Of course there could be room for a lot more improvements.
My failover-restart bash scripts are awful, though they do seem to work more or less and counteract the USB unreliablilities
There were some changes to Smoothie Charts that I could improve on: logarithmic plotting, some display enhancements, wonder if it can be more optimized for performance
More efficient data loading. 12h data is about 30Mb in JSON format, that I send compressed, apparently it gets down to ~5% in size, but it still takes quite a bit of time to process on the frontend
The layout now can be changed from config files if the sensors change, so co-workers can do that without programming knowledge. I wonder if that can be simplified even more
Of course, I’m a person who generally overengineers stuff, so maybe it’s good to stop somewhere. And the somewhere might be when I got to the point to use my Kindle for monitoring (craps out on 1h data already, but some real time things are good enough).
Bakeout Monitor on running on Kindle 3, not perfect but does work
Get on with it
I did learn a lot along the way, and I’m sure that with this experience I will be let to do a little bit more in the lab in terms of programming ideas. I don’t like that the rest of the system is currently forced to be LabView, but that’s for another post, and there are so many things that can be improved in general as well. Let’s just go and do that.
I was catching up on StartupBus, an awesome (crazy? probably both) project that I really wish I could take part in. One part was watching the videos they shared in Youtube, especially one series by Phil McKinney (Chief Technology Officer at HP), where among other things he talks about the Rules of the Garage (the garage where HP was started). It is very inspiring I think those rules should apply not just in business but many other creative team effort. Such creative team effort is, for example, a physics lab, just like the one I’m working now. And indeed this group would need some philosophy infusion like this.
Believe you can change the world.
Work quickly, keep the tools unlocked, work whenever.
Know when to work alone and when to work together.
Share tools, ideas. Trust your colleagues.
No Politics. No bureaucracy. (These are ridiculous in a [lab]).
The customer defines a job well done. [?]
Radical ideas are not bad ideas.
Invent different ways of working.
Make a contribution every day.
If it doesn’t contribute, it doesn’t leave the [lab].
Believe that together we can do anything.
Invent.
These are so well formulated that they give more of an “aha!” feeling instead of a question that “yeah? why’s that?”. Researchers should have all of this drilled in. Or rather everyone should have.
The only one that I’m not satisfied by is #6: what constitutes a “job well done” in academia? No customers so no direct measurable response to the effort. The commonly used metrics are amount of grants won, number of members who won tenures, number of publications and/or citation, conference invitations, and so on, none of which really captures what science is about and why people should be doing it. But then what is the metric? Maybe this is a problem in general, no clear aim makes unfocused effort. Or is it a strength as people can define their own measures of success? I don’t think that’s the right way either. I usually go by the “amount of curiosity satisfied and new things learned”. But since I feel I have learned an awful lot lately but still barely going forward, maybe I’m not the example of someone who should be followed on this.
Anyway, I wanted to post this, because it needs a bit more thinking and have to start somewhere. And indeed there’s a lot to do…
Just a random landscape on the optical table
Now back to work. But better this time, there’s a world to change.