It all started a few weeks ago with Sparkfun having “20%-off” day, when I got myself (among other things) a BMP085 barometric pressure sensor. When it arrived, I have soldered some pins on it, and set it up with an Arduino Nano, to have the readings off it easily.

Originally all I wanted is just some laid back pressure recording, so maybe I can use that to predict the weather a bit. “Pressure falls: bad weather comes, pressure rises: things will clear up”. I was recording for about a week, and nothing really noteworthy came out of that.
Then it was the news, that the year’s first typhoon is on the way to Taiwan, and it was supposed to be a big one. Obvious that I will try to record the barometric pressure pattern of its passing, but wanted to make it more interesting and informative. More visual than just the timeseries plot of pressures.
The Japanese Meteorological Agency (JMA) is a good place to watch for information about typhoons. They list path prediction, typhoon properties like strength, wind speeds, and central pressure, have satellite imagery. Putting these together, two days before the typhoon arrived, I set up a script to download the satellite imagery as it became available.
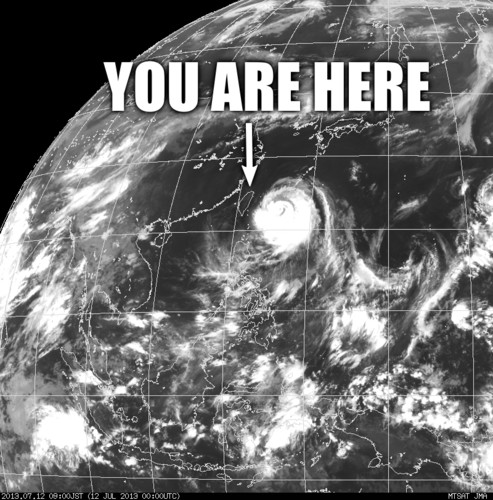
The JMA publishes usually 2 satellite images in an hour for our North Western Quadrant (at :00 and :30), one of them covers the whole area, the other covers just the top 80% or so, leaving a dark band on the bottom. Nevertheless, matching up the pressure reading with the satellite pictures would be a good little project for this time.
Friday came, the government gave the afternoon off, though it turned out no landfall happened till everyone supposed to be off anyways, just a bit of on-and-off rain. People stocked up on convenience store food (I now have a good supply of instant noodles:) and water, taped over their glass windows, take in their plants and BBQ equipment from outside – well, those who have planned.
Around 10pm the big rain has arrived, here’s a video of how it looked from my window. Went to sleep later, and got woken up around 3:30am by the rain having changed into pretty darn big wind. Here’s another video of the violent part of the typhoon that time in the morning, that doesn’t even really do it justice. The houses around here are pretty tall, and I wonder if they have protected from the wind, or been artificial canyons channeling it. Some things got broken, though not as much as I expected – which is a very good thing.
In the meantime by the power of the Internet I have checked out the pressure reading, how is it going a few miles away in the Taipei Hackerspace, where I have left the barometric pressure sensor (the geolocation is 25.052993,121.516981)
Here’s the entire recording of the approximately 2 days of typhoon. It was pretty okay weather in the start and end of the plot.
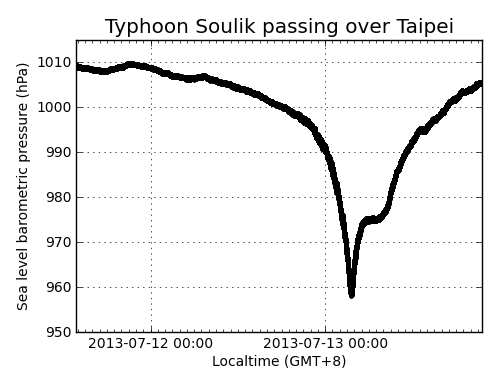
The readings have been corrected to sea level (from about 20m height, where the Taipei Hackerspace is), should be good within 1hPa or less.
The the pressure was indeed dropping like a rock, and the dip on the graph coincided with the most violent wind that woke me up. According the JMA, the central area of the typhoon had pressures down to 950hPa, which means that core must have passed pretty close to here, having readings below 958hPa, though probably not directly, as it didn’t stay down there for long.
I made a video syncing up the pressure reading and the satellite picture. The red dot on the video marks the recording location. (Watching it in full screen and HD makes it clearer.)
I would wonder what was the flat part in the readings while the typhoon was leaving. Maybe sign of changing direction, by the look of it.
Either way, this was fun to do, and I am glad that only a few people got hurt here, much fewer then even during the less powerful typhoons. Maybe getting people scared a little (like with this “super typhoon” stuff that went on) helps them keep safe? Just don’t use it too often.
Extra material
I put almost all material used here into a gist: the satellite imagery download script, the plotting, the movie frame generation, the movie generation script, and the complete barometric recording. Because this last part is pretty big (5Mb), Github truncated the rest of the scripts. I guess it’s okay to check check it out. Will add the Arduino sketch to read the sensor and the logging script later.
The satellite imagery weighs about 60Mb, so don’t put it online, but if anyone wants them, let me know.
Keep safe!
One reply on “Barometric recording of Typhoon Soulik”
[…] USB Solar Cell (FUSC). Generally there's a lot of sunshine here in Taiwan (when we don't have a typhoon), and even if I cannot power my laptops from it, could certainly try to power my […]