Categories
Maker Programming

Electronic check-in at the Taipei Hackerspace

One issue we have frequently at the Taipei Hackerspace is that people don’t know when we are open. Our  basic rule is simple: whenever a keyholder member is in the Hackerspace, anyone/everyone can come. In practice people never really know if anyone’s there.

They could give a call to the space, or even send an email to the mailing list, while the people I know usually end up asking me directly – hey, anyone’s at the space at the moment? Since I don’t always know the answer, the search was on for a better – maybe more technological or hackish solution: let’s build an electronic check-in/out system that will show the current status on out website, so people can check right there.

I had the following idea in the back of my mind for a few weeks and even got the hardware acquired, but one of our co-founder had to call me out by name on the mailing list, a few days ago to swing into action. So now here it is, kinda working, ready for real usage.

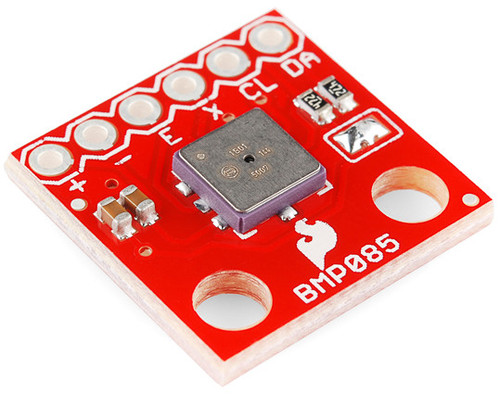
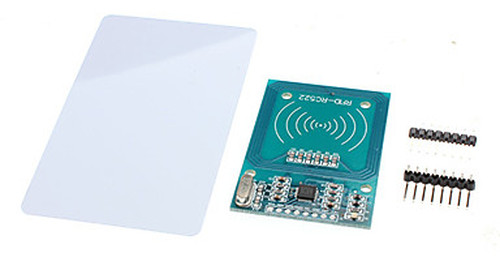
The main idea is that in Taipei pretty much everyone has an EasyCard, an 13.56MHz RFID card that is used for all public transport in the city and a lot more. The RC522 card-antenna module seems to be able to read the card pretty well, and all I need to get off it is the the ID number which is pretty straightforward (after digging the Arduino forums for source code).

The project in a nutshell is:

  • Use Arduino Mega with an RC522 board to get the ID number of a given EasyCard
  • Use witches to get whether the person is checking in or out
  • Use LEDs to provide some feedback and basic user interface for the hardware
  • Node.js server to communicate with the Arduino, interface the check-in/out database, and provide API and realtime access to the data
  • Create a bit of interface on the website to display the check-in status

Now let me dig into the different parts in detail.

RFID

The RC522 module has 8 pins, and Arduino can use the SPI library to communicate with it. I used Arduino Mega ADK, because the SPI pins are conveniently accessible, unlike e.g. the Leonardo, for which I would have had to make some new cables or headers. The RC522(pin number)->Mega(pin number) connections are done such that:

  • SA(1) -> SS(53)
  • SCK(2) -> SCK(52)
  • MOSI(3) -> MOSI(51)
  • MISO(4) -> MISO(50)
  • (5) not connected
  • GND(6) -> GND
  • RST(8) -> (any digital pin)
  • +3.3V(8) -> +3.3V
Photo of the electronics
RFID-RC522, with blank card and pins

The source code to talk to the card is from a blog, and originally from a tech shop in China, I guess (based on the big bunch of Simplified Chinese comments).

Switches and Visual Feedback

I wanted to make as simple interface for the card reader as possible. Added this pair of switches and LEDs (the D1 being green, and D2 being red). After the Arduino received a card ID from the reader, the LEDs are blinked to prompt people to press either the Check In or Check Out buttons. If they press either of them, the corresponding LED is blinked very brightly for a bit, and the card ID and check-in/out event is sent to the connected computer via serial connection

The (very basic) circuit for the check-in/out buttons and visual feedback LEDs
The (very basic) circuit for the check-in/out buttons and visual feedback LEDs. “Pins” refer to the Arduino pins used in the current version

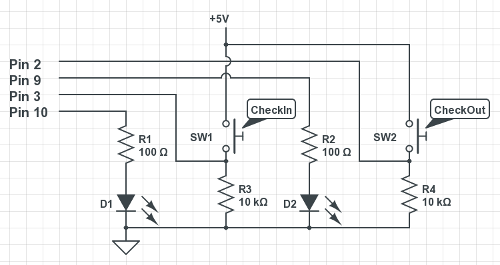
If no button press occurs within 10 seconds or so, the reading is discarded and the card reader goes back to listening mode.

Webserver

Node.js is very useful to make quick web services, and its library support is not too bad at all, although it’s not all smooth sailing: their documentation is often scarce at best. Nevertheless it was the fastest one to get things up and running, since I have used before almost all required components.

The server communicates with Arduino via the serialport library. I’m more used to Python’s pyserial, though in this case it was very handy that serialport can emit read events, thus the server can just wait until there’s something to read and run some functions on the incoming data. In my experience, serialport wouldn’t be good for every cornercase I came across in serial-land, but in this setup works beautifully.

I chose SQLite3 to store the data, using the sqlite3 library. There are a bunch of others, had to look around which one is still being developed. This particular library is not too bad, though I found myself fighting the lack of documentation and asynchronicity quite a bit. The resulting code is pretty ugly I’m sure, in some places inefficient because I didn’t know how to get to the result I wanted in a less roundabout way, still it seems to work and that is what matters for a prototype.

First I made a simple REST API to query the currently checked-in people, and later added (real-time) push updates via socket.io, to make it nicer. It’s brilliant that without any polling, all clients can be updated once someone signs in or out.

Since this code is running on a different computer than our main web server, had to play around with the Access-Control-Allow-Origin header, and adjusting the settings of our  router to make it accessible for the web correctly.

Tried to add a pretty-much self-contained script that the front-end can load, and it handles everything, just need an appropriate HTML span or div element to display the information.

Photo showing the circuit used for the check-in system
Hardware setup for checking in/out: Arduino Mega, RFID-RC522 circuit, and some switches and LEDs.

The result is pretty good, as long as the card-reader does not crash. Originally the results were displayed in a table, but wanted to make it more human, so here’s the format I ended up with:

Website screenshot showing two people checked in
Screenshot of the homepage with one particular check-in situation.

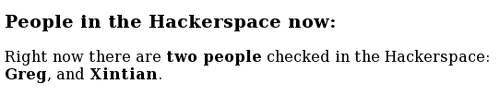
There can also be people with no name, they just show up something like “Right now there are three people checked in the Hackerspace: Greg, and two other people.”
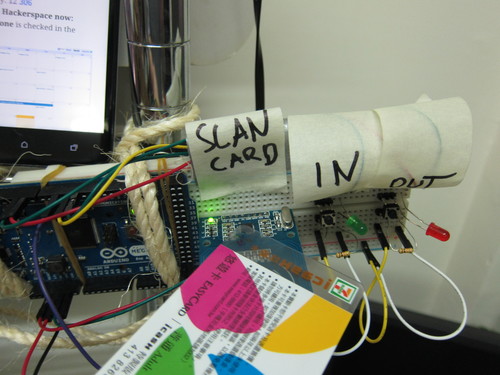
It lives!

Here’s a quick demonstration video of how does it work:

So you can check out our website at http://tpehack.no-ip.biz/ for the live results, and drop in if you are in the neighbourhood if there’s anyone in the ‘space.

The whole source code is shared in a Github repository: the Arduino sketch, the server script, and any additional files. I’m sure there are a lot of things that could be improved about it.

Categories
Programming Taiwan

Barometric recording of Typhoon Soulik

It all started a few weeks ago with Sparkfun having “20%-off” day, when I got myself (among other things) a BMP085 barometric pressure sensor. When it arrived, I have soldered some pins on it, and set it up with an Arduino Nano, to have the readings off it easily.

View of the circuit
BMP085 barometric pressure sensor breakout board from Sparkfun

Originally all I wanted is just some laid back pressure recording, so maybe I can use that to predict the weather a bit. “Pressure falls: bad weather comes, pressure rises: things will clear up”. I was recording for about a week, and nothing really noteworthy came out of that.

Then it was the news, that the year’s first typhoon is on the way to Taiwan, and it was supposed to be a big one. Obvious that I will try to record the barometric pressure pattern of its passing, but wanted to make it more interesting and informative. More visual than just the timeseries plot of pressures.

The Japanese Meteorological Agency (JMA) is a good place to watch for information about typhoons. They list path prediction, typhoon properties like strength, wind speeds, and central pressure, have satellite imagery. Putting these together, two days before the typhoon arrived, I set up a script to download the satellite imagery as it became available.

Satellite picture of Typhoon Soulik and location of Taiwan on 2013-07-12 morning
The morning before the typhoon arrived

The JMA publishes usually 2 satellite images in an hour for our North Western Quadrant (at :00 and :30), one of them covers the whole area, the other covers just the top 80% or so, leaving a dark band on the bottom. Nevertheless, matching up the pressure reading with the satellite pictures would be a good little project for this time.

Friday came, the government gave the afternoon off, though it turned out no landfall happened till everyone supposed to be off anyways, just a bit of on-and-off rain. People stocked up on convenience store food (I now have a good supply of instant noodles:) and water, taped over their glass windows, take in their plants and BBQ equipment from outside – well, those who have planned.

Around 10pm the big rain has arrived, here’s a video of how it looked from my window. Went to sleep later, and got woken up around 3:30am by the rain having changed into pretty darn big wind. Here’s another video of the violent part of the typhoon that time in the morning, that doesn’t even really do it justice. The houses around here are pretty tall, and I wonder if they have protected from the wind, or been artificial canyons channeling it. Some things got broken, though not as much as I expected – which is a very good thing.

In the meantime by the power of the Internet I have checked out the pressure reading, how is it going a few miles away in the Taipei Hackerspace, where I have left the barometric pressure sensor (the geolocation is 25.052993,121.516981)

Here’s the entire recording of the approximately 2 days of typhoon. It was pretty okay weather in the start and end of the plot.

Plot of pressure readings
Pressure reading during the passing of Typhoon Soulik, recorded at the Taipei Hackerspace

The readings have been corrected to sea level (from about 20m height, where the Taipei Hackerspace is), should be good within 1hPa or less.

The the pressure was indeed dropping like a rock, and the dip on the graph coincided with the most violent wind that woke me up. According the JMA, the central area of the typhoon had pressures down to 950hPa, which means that core must have passed pretty close to here, having readings below 958hPa, though probably not directly, as it didn’t stay down there for long.

I made a video syncing up the pressure reading and the satellite picture. The red dot on the video marks the recording location. (Watching it in full screen and HD makes it clearer.)

I would wonder what was the flat part in the readings while the typhoon was leaving. Maybe sign of changing direction, by the look of it.

Either way, this was fun to do, and I am glad that only a few people got hurt here, much fewer then even during the less powerful typhoons. Maybe getting people scared a little (like with this “super typhoon” stuff that went on) helps them keep safe? Just don’t use it too often.

Extra material

I put almost all material used here into a gist: the satellite imagery download script, the plotting, the movie frame generation, the movie generation script, and the complete barometric recording. Because this last part is pretty big (5Mb), Github truncated the rest of the scripts. I guess it’s okay to check check it out. Will add the Arduino sketch to read the sensor and the logging script later.

The satellite imagery weighs about 60Mb, so don’t put it online, but if anyone wants them, let me know.

Keep safe!

Categories
Programming

I got my Pebble, now let’s play

Just received my Pebble smartwatch yesterday, a bit more than a year after the Kickstarter campaign has ended. Its pitch is being a watch with e-paper display, Bluetooth communication with Android and iOS, a Cortex-M3 ARM processor, with the ability to run programs that change the watch look (“watchfaces”) or provide extra functionality (“watchapps” ).

I almost forgot about that I have supported it, until my friends on Facebook started to receive theirs, and I run into a person recently wearing one (the red coloured one, mine is gray and that was manufactured later). Even if I’m not really a wristwatch person – haven’t had one for years -, I like watches in general and clever new tech all is always welcome with me. (I wonder if any of these will be  in pocket watch form some day).

Pebble watch showing the time, 2:45
Pebble watch in action. Or just chilling and showing the time anyways.

Setting it up was pretty easy, the Pebble app on Android does pretty much everything. Setting up notifications for emails, Facebook messages, calls and SMS is one of the first thing. Until I get overwhelmed them and will turn them off, probably. The app also sets up such that when my phone downloads a file with the right extension (.pbw), it will automatically sent to the connected Pebble. The updates are pretty easy and quick too. I got a bunch of different watchfaces from My Pebble Faces, an unofficial repository that has much more than the official one. Maxed out around 10 or so, then had to use the app on my phone to remove some of them. Easy, though now really feel it all depends on the phone I use as well, the watch is mostly as clever as the accompanying phone app.

Fooled around with it a bit more, checking the alarms, the automatic Runkeeper integration (pretty neat, if only I could switch from “pace” display to “speed” for the watch), some small watchapps. In the case of watchfaces, I switched back to the original “Text Watch” face, which is pretty neat and unique for non-smart-watches. If only it could be modified to write things like “ten oh seven” for “10:07” instead of “ten seven”, it would feel more natural. There’s a watchface called Words o’Date that does that, except that it also adds the date, making the front look a bit too crowded for me. So keeping the original at the moment.

With this playing around I noticed one possible strength of the display, that almost everything can be animated, and that animation is pretty smooth. [Update: it’s actually e-paper, not e-ink, so my bad, the following comparison is not really valid Thanks for the comment.] From my limited experience with e-ink in the form of reading on my Kindle Touch, Pebble is really agile. Looking in the the Software Development Kit (SDK) documentation, there is a lot of functionality dedicated to animation.

After the whole day of usage I was thinking that when I was young(er), I would start hacking on interesting things right away, would have a lot of ideas, put in loads of effort, oftentimes stay up late to make something new to work. These days it’s less like that, even if I have much more toys lying around waiting to be hacked on. Around dinner time I decided that it cannot continue like that, so before going to sleep, will have my very on watchapp done.

Magic 8-Ball

Didn’t have many ideas, though, and haven’t looked yet too much, just wanted something simple. A Magic 8-Ball came up as a possibility: an app that gives you answers to your yes/no questions. It’s pretty easy in the core: a bunch of stock answers (20 in the original case), a random number generator to choose from them, and display it. Can do just bare text for the first time.

To set up my Linux box for the development, got the latest Pebblekit from Github, which is the SDK and examples and all the tools together. Unfortunately everything inside relies on “python” being Python 2.x, and on my ArchLinux this is not the case. The quickest workaround I found was to use Python’s virtualenv. I have also needed a different version of GCC that compiles for the Pebble’s ARM processor, the arm-none-eabi-gcc, fortunately in the ArchLinux User Repository (AUR). It just took a looooong time to compile. These two steps put me right into business and been able to compile the example watchapps and watchfaces.

I don’t remember much of my C skills (never had that much), that are mostly kept alive just by Arduino programming. Fortunately the Magic 8-Ball is simple enough program that looking at the examples, Stack Overflow, and Github, I could find all the pieces I needed (array of strings, random number generator in C, text display).

The Magic 8-Ball app is showing its result to my question: ask again later.
My first watchapp, the Magic 8-Ball

By around 1am I had a working version, and it’s totally fine. It’s even fun, even if very simple. People can get it directly from its page on My Pebble Faces, and apparently while I was writing this, 3 people already did, sweet!

In the future, I would like to keep up this creative hacking. For the Magic 8-Ball I could include some graphics, maybe neater transitions, make it less an “example” app and more an app. It’s really cool, that so many of the uploaded watchapps and watchfaces on My Pebble Faces also share their source code (50% of the 500 items, can filter for it in the search form), so I can learn from that. How much better Android apps would be if they’d do the same? My code is also on Github, naturally, in the magic8 repo.

For Pebble in general, communicating with the phone over Bluetooth can be very useful, if a useful Android app complements it. Smart clothing and accessories are just going to be more prevalent. There are already “next generation” smartwatches out there, like the Agent, that will be cool in a different way (I haven’t supported yet, they got 10x funding anyways).

Also, I think I should put some effort into compiling Libpebble for my laptop, that would make it possible to cut out the phone as a middleman and make things more future proof.

And as a first priority, I should be getting used to wearing a watch again, it’s been a while.

Categories
Computers Lab Programming

OSLO is a strange one

Experimental physicists have to be the jack-of-all-trades, even on a good day, but building a new laboratory, on a budget (for any definition of “budget”) and with a limited team, is an exercise that would test anyone.

For my field, atomic physics, one needs a lot of different expertise: vacuum systems, computers, electronics, machining, optics are among the ones first to my mind. Today I’m looking at one of the tools that we are using for the last topics: optics.

In some ways, optics is pretty straightforward (both geometrical and diffraction optics), many of the calculations one could write in Python/Numpy just as well, as any software can do it. They are just pretty tedious, and there are a lot of them, optics is not a new profession. Some optics design software is very useful then, and there are not that many of them, lots of work goes into the ones that exist, thus they can be extremely expensive. One of the industry standard seem to be Zemax, and many lens manufacturers provide the specs of their lenses in a Zemax format – though it is fortunately just a relatively simple text file. On the other hand, its cheapest edition is $2500, and goes up to $9500…

Another serious competitor is OSLO (Optics Software for Layout and Optimization) which is still very well known, and fortunately for us, has a dumbed down (limited number of surfaces, not all the functions available), EDU version, for free. It even runs on Linux with Wine.

I instinctively resist any software in science & research that is not free & open source, because I feel that it closes some people out, though had to use something, and in the meantime I have grown to OSLO quite a bit.

OSLO ray graph of an imaging system
One of our imaging system design

Using OSLO, I have found that one big advantage of these software is their catalog: the glasses (oh-very-important for optics) and stock optics of different companies. This alone makes everything much easier.

What does the lens designer software do? You enter the parameters of some lenses by defining different surfaces and materials & distances between those surfaces, give it some lightbeams, and see what comes out of it. Most of this happens in this window:

The window to enter the system parameters
Lens spreadsheet

After these settings, one can run a number of different analytics code, checking the performance and behaviour of the system by calculating a bunch of physics parameters, or can modify the system to optimize that performance one way or another.

This is where the number 1 strangeness – and big bonus – comes in: OSLO can be scripted in a language called Compiled Command Language (CCL), which is a subset of C; and not just scripted, but the whole program is written on top of the CCL compiler (as I understand)! The result of this is that:

  • Your scripting can be just as powerful as the entire program, since both sides have the same functions accessible
  • There are a bunch of scripts included in the main version and even if CCL itself feels poorly documented, there are plenty of examples to learn from
  • Once your script is compiled for OSLO, it can be totally part of the system, your own menuitems, options, defaults, everything
  • Scripting is not just bolted on later, but the whole software feels like a result of “eating your own dogfood“, resulting in a much better experience.

Optics design is tedious, so once I figured out how to do the scripting, everything just become nicer. Haven’t had time to do a lot of things, but the script I have so far is open source, and hope to add other things later.

From the programming point of view, there’s one more strangeness. Starts with that the output of numerical calculations looks like this:

Window showing numerical results of a lens' calculation
Looking at some numerical results

Those are all results from different functions, calculating spot sizes and wavefront distortions and what not, and those can be run from your own script – but the return variables are just printed. And they are a table. Those are table values that have to be accessed, so for example if I want to have the Strehl Ratio there, I would have to assign the value of something like “c1” to my internal variable – c for 3rd column, 1 for first row. Though to be this simple my code would have to clear the existing table before running the wavefront function correctly. This results in a lot of counting on the screen to see what row/column output of a function I want to actually use.

Internally, I think most of the calculations are following a finite number of rays. Finite but very high (~1000). The big problem, that could get the unsuspecting people (like I was), that what looks like a continuous calculation, is actually digital. For example if I set an aperture within the system that cuts into the incoming rays, and keep changing the aperture size (which is just a real number), the output results don’t really change unless I exclude or include some of the beams that OSLO is using for calculation – thus the result is changing in steps, and hard to trust. I guess there should be a setting somewhere to change the number of rays used, but still trying to find it.

It is one clever program though. The input and output parameters of a lightbeam are really connected by the system, since practically speaking, the optics are just transforming some parameters of the beam into other values, thus if I set the input parameters, the output is given. With OSLO they do this in a way, that the code just follows what parameters you have changed last time (input beam size? output image angles?…) and that will be a fixed variable, while everything else is adjusted. Some parameters disappear when others take certain values (set your object very far away? then we don’t have to let you set your object size, since it’s not important, instead give you a viewfield angle). It’s funky when I figured it out, but took a while…

I don’t know how much longer I’ll have to use it at work, but this looks something that really tickled my interest learning optical design much more, and once I have the hang of the quirks, it’s pretty neat. If anyone’s interested, there’s a pretty useful mailing list.

Now if only there was an open source solution… : )  (please drop me a line if there’s a good one)

Categories
Programming

The Gift of Code

I like advent calendars a lot. They can bring a lot of surprise, preparation, focus, and joy. They can come in many shapes and forms, and they encourage DIY – make your own calendar, count the things that are important.

This year, I got to play with a very interesting “advent calendar”, called 24PullRequests. It is the kind of thing that I don’t understand why people haven’t done it before. The mission: help out open source projects by submitting enhancements and fixes (i.e. “pull requests“), and do that for 24 days counting down to Christmas.

my 24 Pull Requests calendar

I had to take part in that one, and while the result wasn’t as successful as I wanted, it was so far my best contribution to open source.

My pull requests

Instead of 24, I managed to make 4 enhancements that were ready to be sent off. That’s not consoling me that it seems nobody managed 24, but never mind. Here are the things I made:

  • SmoothieCharts: make the charts use newer browser animation technologies that have better performance, and save on battery as well. This one was prepared somewhat earlier than December, but the final version was pushed within the right time frame. Being tested, not merged yet.
  • OpenHack: I’m organizing the event in Taipei, and noticed that some other place has broken image link. Hunted down the same pic from Google Cache, and set it up again.
  • Python Guide: added some info about installing certain Python packages in Arch Linux and Ubuntu. This is embarrassingly tiny fix, there’s so much more to do here
  • AngularJS: this is fixing that one couldn’t run the build script if the system Java can’t run in 32bit mode. I didn’t know that this was a Google project, until they sent me a request to sign some contributor agreement. I feel strangely humbled.

Lessons learned

Four contributions were already a lot of experience, because all of them were so different. Here are some lessons learned:

  • Write good pull requests – that starts with writing good commit message! People keep saying that, but seriously, no excuse not to do that.
  • When the changes have been sent in, don’t mind that they are not accepted yet. Every project have their own pace. Keep working on whatever you like
  • I was looking for ow hanging fruit, but one has to go in there still to make some meaningful contribution.
  • The issue tracker is a good start to see what to fix, but not always helpful, as it can be difficult to understand what propblem the others try to describe, if you are new to the project. On the other hand, try to use the code, I’m sure you’ll find some pain points right away (that was AngularJS). Also, the busiest issue trackers are not the best, they are full of things that would side-track you for a long time. Projects with a medium count are good for such an improve-and-run contribution.
  • Don’t be afraid to do things, but still do them the best you can. Your contribution doesn’t always feel meaningful, but still a little improvement is more than most people do. (just like PythonGuide was)
  • Keep things simple – easier to do, easier to pull. Even if sometimes that takes longer to write (the AngularJS contribution srunk to the quarter of its size while I was trying to figure out the simplest way to achieve what I wanted)
  • If interested, don’t worry if the project uses programming language you don’t know. You can pick up new things easier than it seems. Also, many projects give you feedback on your contribution, to help you improve it.
  • This project don’t encourage to work on your own stuff, but that doesn’t matter, there are another 11 months for that, or every day after these contributions are done
  • How to do this for the whole year? Bug squashing day in general? Still need to get deeper in projects, but go and explore. Can also see CodeTriage and ContribHub, linked from 24PullRequests
  • If stuck in the fixing, but the problem is interesting, don’t worry if it doesn’t fit in the 24 days. Keep working on it, the recipients will be happy any time (I have have 1 or 2 such patches)

Now let’s be a better coder in 2013.