
Recently I begun fully remote working from home, with the main network connectivity provided by a 4G mobile router. Very soon I experienced patchy connectivity, not the greatest thing when you are on video calls for half of each day. What does one do then (if not just straight replacing the whole setup with a wired ISP, if possible), other than monitor what’s going on and try to debug the issues?
The router I have is a less-common variety, an Alcatel Linkhub HH441 (can’t even properly link to on the manufacturer’s site, just on online retail stores). At least as it should, it does have a web front-end, that one can poke around in, and gather metrics from – of course in an automatic way.

Looking at the router’s web interface, and checking the network activity through the browsers’ network monitor (Firefox, Chrome), the frontend’s API calls showed up, so I could collect a few that requested different things like radio receiving metrics, bandwidth usage, uptime, and so on… From here we are off to the races setting up our monitoring infrastructure, along these pretty standard lines:
- Set up a Prometheus metrics exporter, pulling data from the router’s internal API (the same way the web interface does it)
- Spin up a Prometheus + Grafana interface to actually monitor, alert on, and debug any metrics
Metrics Exporter
Given that I’m mostly working with Python, using the existing Prometheus Python client was an easy choice, in particular using their internal HTTP exporter to get started quickly. It was relatively straightforward to turn many of the metrics into various gauges (radio reception metrics, bandwidth used, &c.), though some were naturally info fields, such as mobile network name and cell ID. This latter would be very useful as my hunch was cell hopping by the router is what’s mainly affecting my network quality.
After some poking around I’ve also realised, that the API exposed is just JSON-RPC (although the router’s backend doesn’t seem implement everything in there, e.g. there’s no batch), which made a lot of things clearer, and potentially easier to use.
In the end, I’ve ended up with one class to do all the metrics gathering from a couple of JSON-RPC methods, working relatively robustly. The authentication was simplified very much: most need an auth token that can be extracted by manually observing some requests (more on this later) and some need a referrer header for the request to pretend to be coming from the admin console.
The resulting code is on GitHub: imrehg / linkhub_prometheus_exporter, and should be a full-featured server with most (though probably not all) the metrics available in the admin console as well.
Monitoring
With the metrics exporter running, I used a Docker Compose-based Prometheus + Grafana stack locally to have everything together, just adding an extra “linkhub” task in Prometheus to pull the data periodically, and a new dashboard in Grafana to have a quick overview.
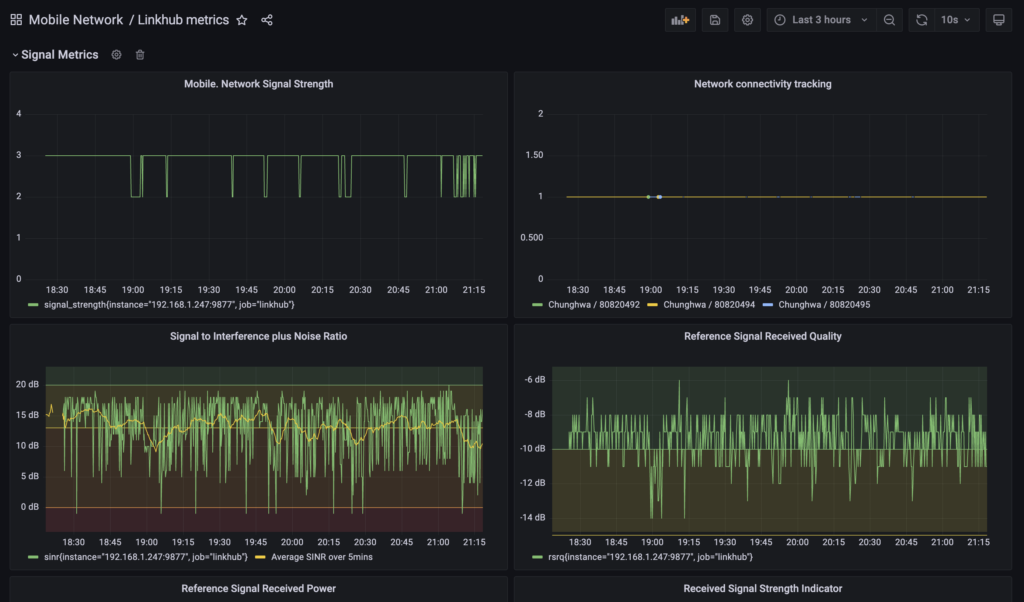
I also went a bit overboard and added some extra bits and pieces, like coloured regions for the signal metrics to show what’s bad / acceptable / good / excellent or so, based on some scouting, making it clearer when things are good or not good.
I also tried to use a bit more of Grafana’s tooling (not a lot, but a bit more), so added some different sections for signal quality and network metrics, as well as a running average on some of the noisy metrics.
Lessons learned
Learned a bunch of things as this was the first time I used, from scratch, many of the tools here. The very first one being: how to choose the right Prometheus metrics for various data streams? Now I see how does it look like in practice, planning for a metric that needs to be monitored from the very early stage. There are fewer varieties of metrics that I’ve expected, and while there’s a lot of derivative stuff to make it a lot more useful, it’s not that everything that one imagines can be made to work.
Used Poetry here more than previously, and set up poetry-dynamic-versioning plugin (as a candidate competitor to setuptools-scm). That meant also using poetry plugins and a beta Poetry release at this stage. It’s not bad, but sooo many gotchas in the process, and still have to figure out what would be a good reusable template for projects using these. (including __version__ variables, etc).
Figured out how to do good CI Docker image builds with libraries that rely on git for versioning, fortunately setuptools_scm did the work for us: bind mount of .git in the specific build step. I think in CI/CD all this reliance of repo data being available can still make things a bit trickier, but something’s gotta give, and it’s not much extra compared to the rest of the things.
Learned a bit about JSON-RPC (and how the router might or might not be fully compliant). Not sure if I’d go with that for any future project myself, but good to be aware of it, and potentially looking at its presence in other routers or interfaces’ communications channels.
Chance to use some Python 3.10-based features (match) and hit/fix some of GitHub actions related issues with 3.10:way to go libraries that convert 3.10 to “3.1″ because it’s a number so let’s round it, right? Or actually way to go libraries/YAML to allow both ‘x.y’ and x.y forms (quoted and unquoted), and the former would have been the correct form all the time, but people generally go with the latter to save a few keypresses. It’s subtle, but experience is expecting the subtleties and the reasons for them arising.
Seen how mypy can actually benefit the coda quality: while trying to fix all the reported issues actually found stuff that was clear benefit and it’s coming not from adding all the type hints (that’s good, but baseline), rather than being smart where it complains and think about what’s the underlying issue (e.g. patterns of getting values out of dicts where there might not be result, exhaustive matching of match and return values of functions, etc…)
The resulting Docker image is north of 1GB due to Python, and that’s not great considering that it doesn’t do that much work. Writing/rewriting this whole thing in Go could be interesting and would be useful learning experience (or another compiled language, I guess, but Prometheus itself is written in Go, so there’s a connection). One step at a time, projects written in Python are useful proof-of-concept to compare other stuff against later, so it was well.
Having said that, I’ve seen the best practices listed when writing Prometheus exporters, and given the current environment, I couldn’t apply all the best practices. For example: “Metrics should only be pulled from the application when Prometheus scrapes them, exporters should not perform scrapes based on their own timers.” The official Prometheus Python Exporter on the other hand seems to need to use exactly that sort of “while True” loop to keep getting/storing metrics, instead if running on demand. There might be a more subtle pattern to do on-demand work (which I see to be more correct), but I need to find it.
So what have I learned about the actual network issues? Most of the instability seemed to be correlated with switching to specific cell towers (based on cell IDs). Certain cell towers would pretty stable, and on some of the days the router was switching between towers, and that’s when most of my online calls were pretty futile.
Finally, I did think a lot about the adage that “something that isn’t worth doing isn’t worth doing well.” On the other hand there’s no kill like overkill, so here we are…
Future development
Compared to other projects I’ve done, this might be lighter maintenance, given that it’s sorta done for the moment (except if others start to use it and need other metrics, for example). Otherwise the Docker-based deployment and poetry.lock’d dependencies make bit-rot a bit slower, hopefully. In the meantime, I’ve switched to a wired connection, so unlikely to need this project much, but it could be that much of this will be repurposed for other monitoring projects.