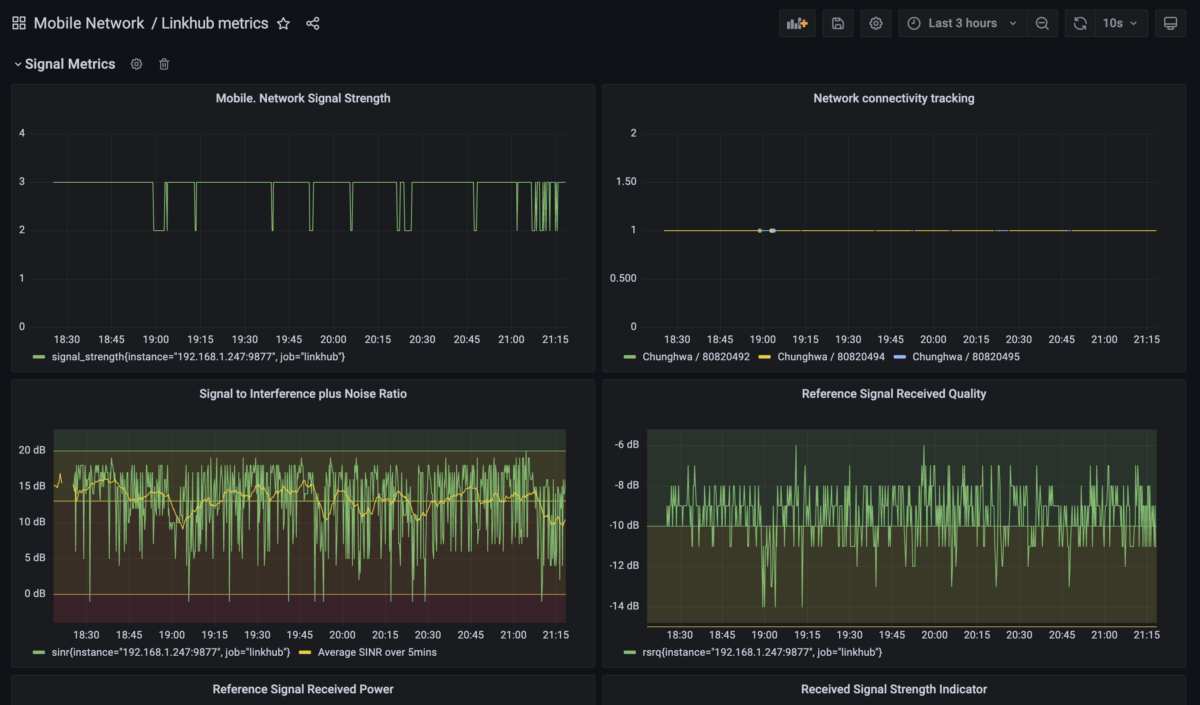
Recently I begun fully remote working from home, with the main network connectivity provided by a 4G mobile router. Very soon I experienced patchy connectivity, not the greatest thing when you are on video calls for half of each day. What does one do then (if not just straight replacing the whole setup with a wired ISP, if possible), other than monitor what’s going on and try to debug the issues?
The router I have is a less-common variety, an Alcatel Linkhub HH441 (can’t even properly link to on the manufacturer’s site, just on online retail stores). At least as it should, it does have a web front-end, that one can poke around in, and gather metrics from – of course in an automatic way.

Looking at the router’s web interface, and checking the network activity through the browsers’ network monitor (Firefox, Chrome), the frontend’s API calls showed up, so I could collect a few that requested different things like radio receiving metrics, bandwidth usage, uptime, and so on… From here we are off to the races setting up our monitoring infrastructure, along these pretty standard lines:
- Set up a Prometheus metrics exporter, pulling data from the router’s internal API (the same way the web interface does it)
- Spin up a Prometheus + Grafana interface to actually monitor, alert on, and debug any metrics
