A while ago I came across the Formosa (Taiwan) City Plans, U.S. Army Map Service, 1944-1945 collection, in the Perry-Castañeda Library Map Collection of the University of Texas in Austin. I’m a sucker for maps, enjoy learning about history a lot, and I have a lot of interest in my current home, Taiwan – so you can call this a magic mix of cool stuff.
There are 26 maps in the collection, made by the US Army by flying over different parts of the island, and mostly I guess stitching together aerial photographs. The maps themselves were not that easy check in an image viewer, since there’s no context, zoom is clumsy, and have no idea where about half the places should be located. Instead, I thought it would be great to have them as an overlay on top of current maps and satellite imagery on Google Maps.
The result is Taiwan City Maps overlays, which does exactly that. Feel free to click the link and explore right now! In the rest of this post, I try to first show how that page was made, and also some history lessons I gained by making it.
How it was made
The Google Maps Ground Overlay API does exactly what I needed, so can’t claim much (almost any) innovation in the page, though I stumbled on it after a few other “Overlays”, as Google Maps has a couple, all working slightly differently.
Ground Overlay basically takes the following parameters:
- the map’s center,
- zoom level,
- an image,
- the image’s N/E/W/S bounds in geographical coordinates.
- whether to show satellite or maps view underneath
Even cooler, the opacity of the image can be adjusted, so the overlay and the base layer can be viewed together much easier!
In that list above, the trickiest part is of course figuring out the boundaries of the image – basically the way to overlay them – for multiple reasons. First, all the maps have borders with information, titles, legend, and so on. Here below is the Taipei city plan from 1944. I can’t really tell where the corner of the image should be geographically, if there’s nothing to compare to.
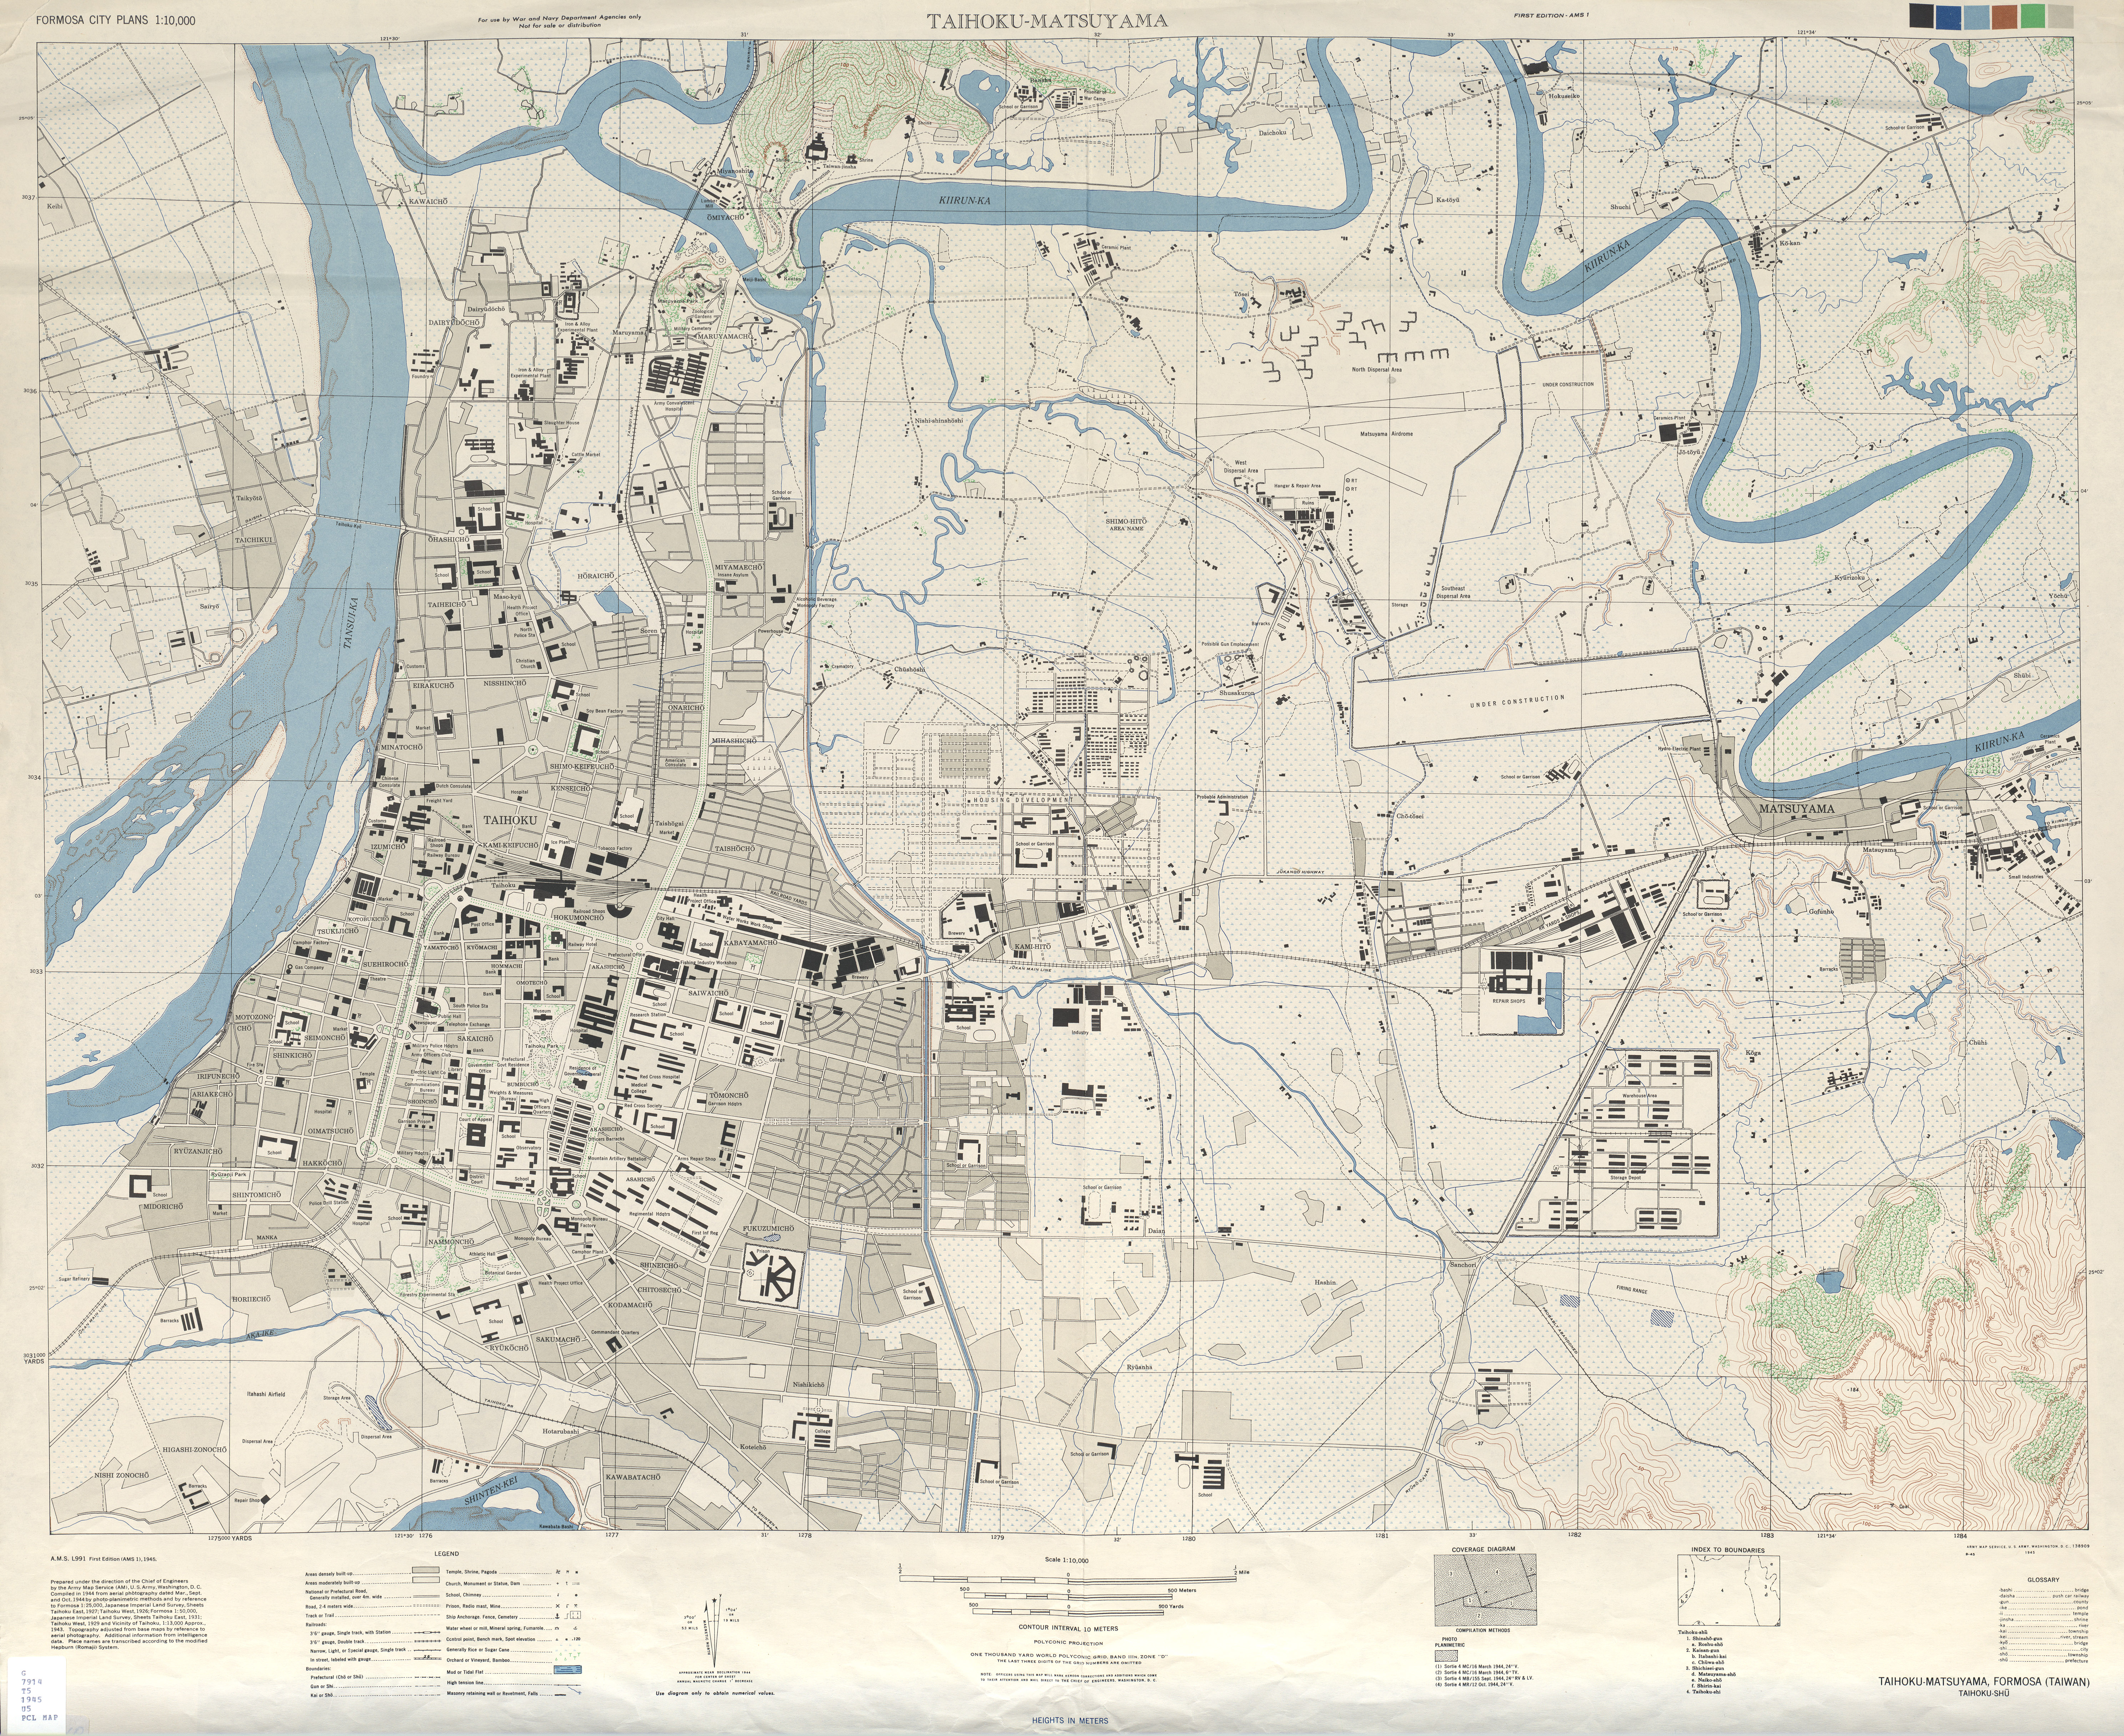
Then there’s also the problem of things have changed in the last ~70 years, so a lot of things are different on the maps, if I want to match them up. Lastly, the maps are not perfectly accurate either, they are stitched from multiple photographs of unknown quality.
Been trying to match the maps by hand for a while, and codings some tools to make that process easier – but it didn’t really get easier. I needed to get to get around all these issues, and have a reasonable, objectively good fit. Objectivity is a key, and math helps with that. What I ended up with doing a linear fit of geographical and image coordinates.
- look for landmarks that are reasonably the same back then and now
- note their geographical coordinates, and their pixel coordinates on the image
- note the image size
- finally: run a linear fit that gives back the geographical coordinates of the image edges that would best match the landmark data in both sources
In really ugly Python it would be something like this:
import numpy as np

# # For example the contents of "taoyuanfit.csv":
# # Landmark data: image vertical/horizontal (px), latitude/longitude
# 1677,2861,24.991962,121.322634
# 1597,524,24.992282,121.304856
# 2385,1348,24.986873,121.311122
# 764,1342,24.998116,121.311411
datafile = "taoyuanfit.csv"
points = np.loadtxt(datafile, delimiter=",", comments="#")
imgwidth, imgheight = 3975, 3209

# Points on the image, scaled to range 0 to 1
px, py = points[:, 1]/imgwidth, (imgheight-points[:, 0])/imgheight
# Points on the map
gx, gy = points[:, 3], points[:, 2]
# Do the fitting
lx, ly = np.polyfit(px, gx, 1), np.polyfit(py, gy, 1)

# Fitting parameters give map boundaries, results in this case
west = lx[1]          # 121.300983
east = lx[1] + lx[0]  # 121.331141
north = ly[1]+ly[0]   #  25.003429
south = ly[1]         #  24.981204
This is now pretty objective, and then quality of the overlay depends on the quality of the landmarks I find, and the maps that they are on.
The best landmarks I could turn up were notable roundabouts like below…
… and recognizable streets and intersections, like below…
… but not too small and not too large streets. Large streets have fewer recognizable locations (unless some notable mid-sized street is intersecting with it), and small streets are usually not placed too carefully on the map, so can’t really trust their positions.
What I couldn’t trust, though: rivers (they changed a lot), bridges (usually can’t tell if they are the same bridge in both era, or a new one built close to the no longer there old one, as it is a common practice), coastlines, lakes, large structures.
The minimal number of landmarks needed for a fit (ideally) is just two, and surprisingly, there were a couple maps where I could get along with about three. In most cases, though, I needed at least 4-6 landmarks, and there were some I needed to discard for overall better quality of fit. Some maps show pretty good accuracy, while others (such as e.g. Kaohsiung) are quite poor – compared to today’s satellite pictures, of course. It’s all enjoyable, though.
Then added a few more functions to the page, such as changing the opacity, being able to link to the exact location and zoom level I’m looking at, and some page-load animation (the maps are in the range of 4-10MB, not that quick to load).
The source code for the site is on Github, and pull requests are accepted, naturally.
History lessons learned
I was very interested to note the things that have changed, and things that haven’t in the decades passed.
Things that mostly stayed the same
Schools are usually at the same location, even stayed the same type (e.g. girls’ high school staying that in Changhua).
Airports are usually at the same location (duh!), though usually greatly expanded, while the old runways can be matched to the new ones (like in Hsinchu).
Train stations, of course, although tracks might change, or entire stations disappear (like in Beigang or in Hualien).
Military installations, which surprised me, can stay the same, looks like the KMT troops just took over the Japanese posts and continued to use them. Some turned into schools, or could disappear too.
Many roundabouts, outlines of city blocks (like the CKS Memorial Hall now, or Yilan’s city outline), mountains, also stayed mostly the same.
Things that changed a lot
City areas changed enormously (duh!), just look at the capital, Taipei, the west side stayed mostly the same but built in about twice/three times as big area on the east. Most other cities grown just like that, as it’s very clear for example for Taitung. It’s no wonder, 5.8 million people on the island in 1940, while above 23 million by now (according to Wikipedia). This also brings the changes of a lot of streets and roads.
Water is definitely very changeable. Rivers got diverted a lot, most notably on the east side of Taipei (near Neihu and Songshan districts) the Keelung river was straightened up, but the roads can still mirror the old path. Other rivers (or channels?) got covered up, and now only live on as roads – though I guess they might still flow under our feet (just like Fleet Street)? Some more dramatic change is an entire missing island in Danshui, I wonder what happened to it? Lakes change too, mostly I guess due to development around them (like in Zuoying). The sea shore is different for the many cities, as probably they were developed and also the shallows were naturally filled by the rivers (like in Hsinchu and in Tainan). Harbors don’t stay the same either (like in Penghu).
Some landmarks such as shrines have changed too. The most notable I could find so far is in Taipei / Yuanshan, where the current Grand Hotel / 圓山大飯店 replaced a shrine in 1952 (yellow rooftop on the left below), while the Taipei Martyrs’ Shrine seems to be built on the site of another previous shrine in 1969 (yellow rooftop and cross-shaped grounds on the right below). On the map there’s another temple-complex looking structure in between them, that’s now the Taipei American Club and the International Community Radio Taipei (ICRT).
Race courses disappeared too – together with the cavalry, I guess (like in Tainan).
I’m sure there are a bunch of other things too, it will take some time to discover and understand things…
Other notes
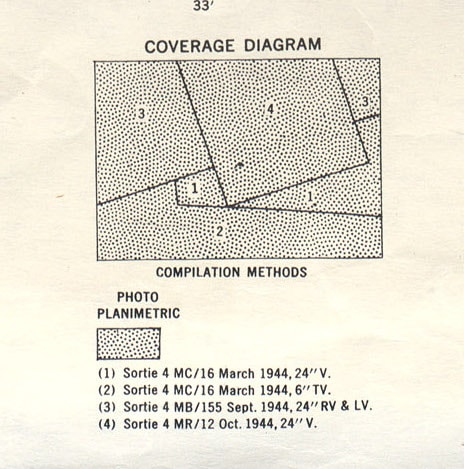
The legends and information on the maps was pretty interesting. For example here’s the coverage map for Taipei / Taihoku, showing what aerial maps they stitched together, and when were the flights that took the photos:
The Internet also taught me a few things, such as this very insightful comment on Reddit that traced back the Chinese / Japanese city names of these maps.
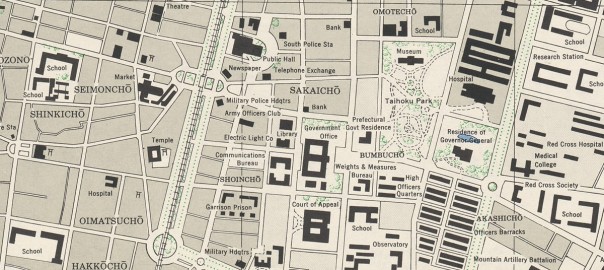
I was also amazed by how detailed information the Americans had about the functions of the buildings – down to the type of factories, the type schools the buildings were. I would not be surprised if the maps were supplemented by some real intelligence from the ground. Especially likely as the big cities had so much more such details than the smaller locations (where there might not be more than a few likely military installations noted). I wonder if there’s any good source to learn about this – about American intelligence behind enemy lines in the Pacific theatre of WWII.
To the Future
Now that everything kinda works, I think I’ll spend more time looking at the maps instead of working with them, try to learn more.
Hosting this project on Github is definitely pretty easy and convenient, though I start to see that their speed is not necessarily very good for big assets like the map images. Could add Cloudfront very easily to speed things up, just I don’t necessarily want to pay for that extra speed just yet. :P
To be able to show the loading animation I currently need to use jQuery to preload the image, then rely on the browser caching to not to download the image for the second time when the image is attached to the map object to create the overlay. It works pretty well… except in the Facebook Android app’s built in browser – that happily ignores caching and downloads the image twice (ouch). Would be awesome to figure out how can I get directly from the Google Map API when it finished downloading the image.
Might revisit a couple of the maps to see if I can improve the fit, though really just a couple of them, most are totally fine for their quality. Should also add the Japanese writing of the city names for more authenticity and discoverability.
And in the meantime, keep checking the map, and any comment or feedback is appreciated! A big thanks to the University of Texas Libraries and the Perry-Castañeda Library Map Collection for the public domain maps!
12 replies on “Taiwan WWII Map Overlays”
[…] service which is going strong, and looks like it had a real effect; then there’s the Formosa City Plan Overlays page which gave me all kinds of warm and fuzzy feelings; there are also a lot more hardware design […]
Fantastic work, Greg! You should go visit getchee’s office sometime!
Oh, looks interesting, haven’t heard of them before! Do you know anyone there you can connect me up with?
Chris Hubbard – he was working on their digital marketing. I saw you guys are friends on fb :)
Oh, good, I didn’t know he’s there (or was maybe?) I’ll ask him about it, thanks!
I am curious. Around the Grand Yuan Shan Hotel, was a river. What they do with the river?
Looking at the full map, they redirected it. There are a bunch of houses that seem to follow the river’s old path, which is interesting…
Thanks Gergely,
I’ve used these maps extensively for exploring old buildings etc.
Curious, as a keen hiker, I’ve recently been thinking about making a similar overlay on google maps with hiking trails using gps data. Any advise on where to start and level of complexity for this? Know a good place to get started? Thoughts appreciated
Hey Bryan, glad you liked this! There’s also definitely a lot more to explore indeed.
For hiking maps, I’m not 100% sure how would that work with Google Maps, but my hunch is it would be a lot more helpful for everyone to add those GPS trails to OpenStreetMap (OSM), which is much more open to editing, and much more feature rich, both on the data that can be added, and the visual rendering of the results. I did a few rounds of mapping for OSM, though mostly streets, the complexity was sort of medium, but getting better every time (last time I’ve checked was years ago, so should be better by now). See https://wiki.openstreetmap.org/wiki/Hiking and https://wiki.openstreetmap.org/wiki/Hiking_Maps to get started, as well as https://wiki.openstreetmap.org/wiki/Upload_GPS_tracks. I think it would be very cool to expand on the Taiwanese coverage. And would love to hear the results you have! (also helping in the future, when back in Taiwan)
Any chance of adding a “street view”? There are a bunch of Taihoku postcards with specific streets that would be cool to add on as a “street view” version of some locations.
One example: http://digital.lafayette.edu/collections/eastasia/lewis-postcards/lw0510
My compliments to you. This is excellent cartography work you’ve done. Bookmarked.
[…] Maps and Earth parts seem completely: Maps has changed a lot since, as I also had to update my Taiwan WWII Map Overlays project over time too (the requirement of using API keys to even load the map, changes to the […]